MS-008 · Writing
Miscellaneous Papers
Overview
Lab reports and written work from outside the core engineering sequence, collected in one place. Everything here is available in full.
Thermal & Fluid Design and Lab (EML4147C)
A semester of instrumented fluids experiments, each one written up as a formal report with a full uncertainty analysis. The course is in progress, so this section grows as labs are completed.
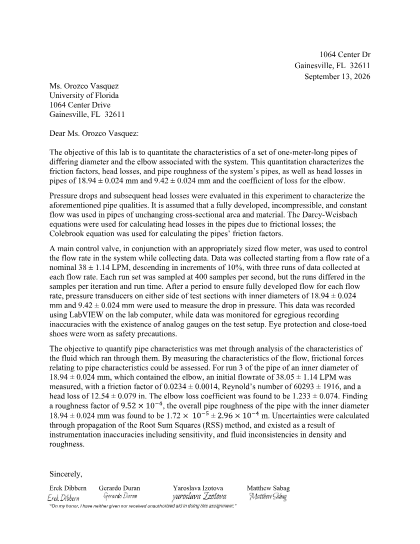
Frictional Losses in Piping Systems
The job was to characterize a hydraulic circuit the way you would before specifying it for a cooling system. Two one-meter pipe sections and the 90° elbow between them, reduced to a friction factor, a head loss, a roughness, and a loss coefficient. Nominal bores were not good enough for that, so the pipes were measured with calipers across five cross sections first. They came out at 18.94 ± 0.024 mm and 9.42 ± 0.024 mm.
At full flow in the large pipe the friction factor was 0.0234 ± 0.0014 at a Reynolds number of 60,293 ± 1,916, with a head loss of 12.54 ± 0.079 in. The elbow came in at a loss coefficient of 1.233 ± 0.074 and the pipe at a roughness of 1.72 × 10⁻⁵ m.
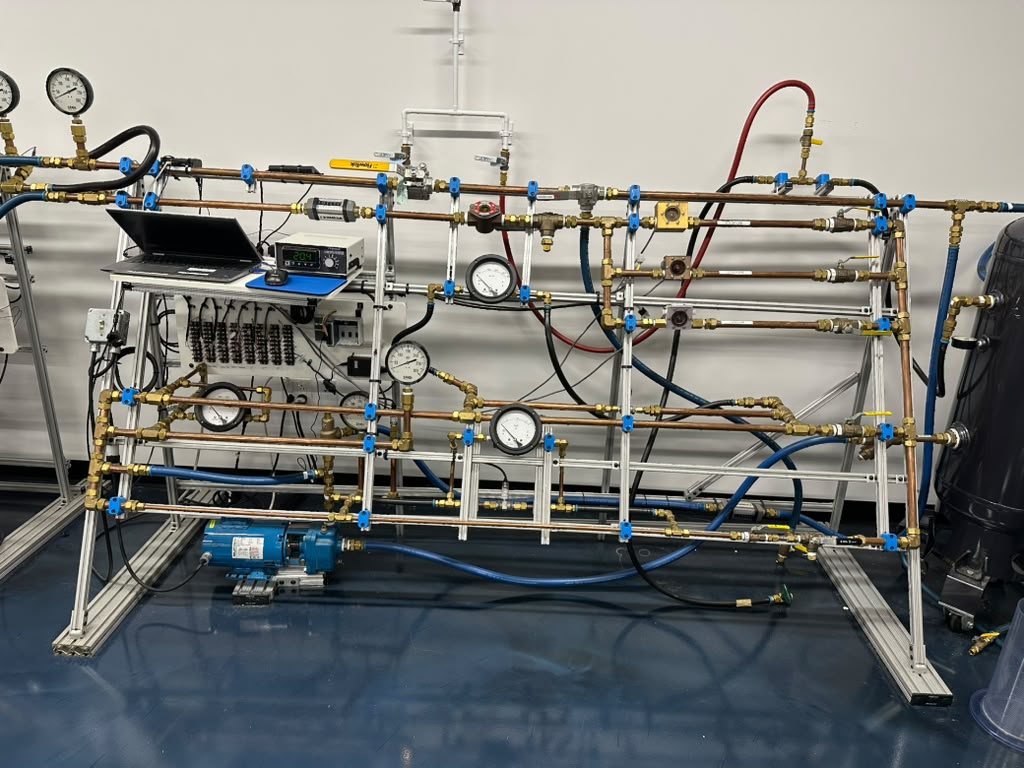 The pipe loss rig, set up for a run
The rig is a copper and brass circuit driven by a 2 hp pump. Differential pressure transducers sit across each test section, three electronic flow meters cover different ranges, and analog gauges stay in the loop as a sanity check on the digital readings. A LabVIEW VI on the bench laptop does the acquisition. One control valve sets the flow, and the run is ten settings from roughly 38 LPM down in 10% steps.
Head losses came out of Darcy-Weisbach and friction factors out of Colebrook. Every uncertainty was propagated by root sum of squares, so the fixed transducer bias and the random sample scatter combine in quadrature instead of getting counted twice.
Two results made the lab worth writing up. A tenfold increase in flow produced only a 24× rise in head loss, not the 100× a constant friction factor would predict. The friction factor is falling as the Reynolds number climbs, which is the behavior the Colebrook iteration exists to capture.
The second came out of the sampling study. The same ten settings were recorded three times at a fixed 400 Hz while the samples per iteration and the run time changed. In the shortest window, the standard deviation at the three lowest flow rates exceeded the head loss being measured. Same rig, same flow, unusable numbers. That is why the ten-second run is the one the analysis trusts.
Raw data, valve photos & apparatus shots Google Drive
Fan Performance
In progress. The fan performance lab report is being written now; the results, apparatus photos and the full report go here when it is finished.
The Optimization of Diesel Engine Efficiency using Modern Innovations
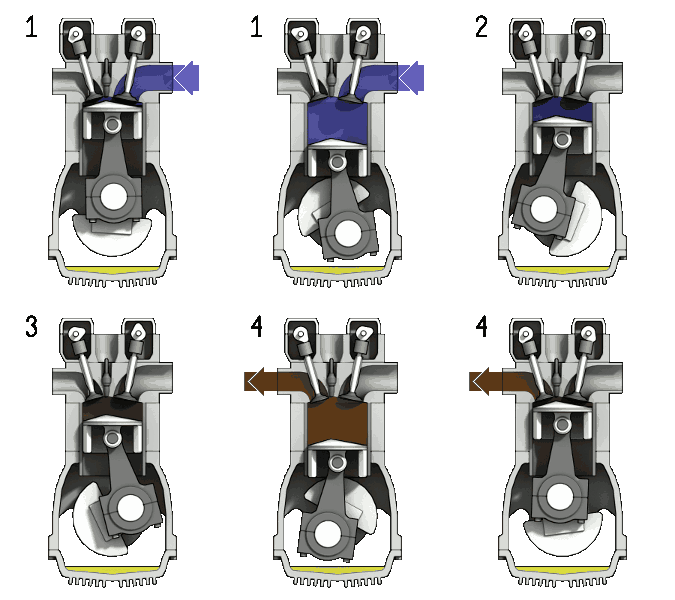
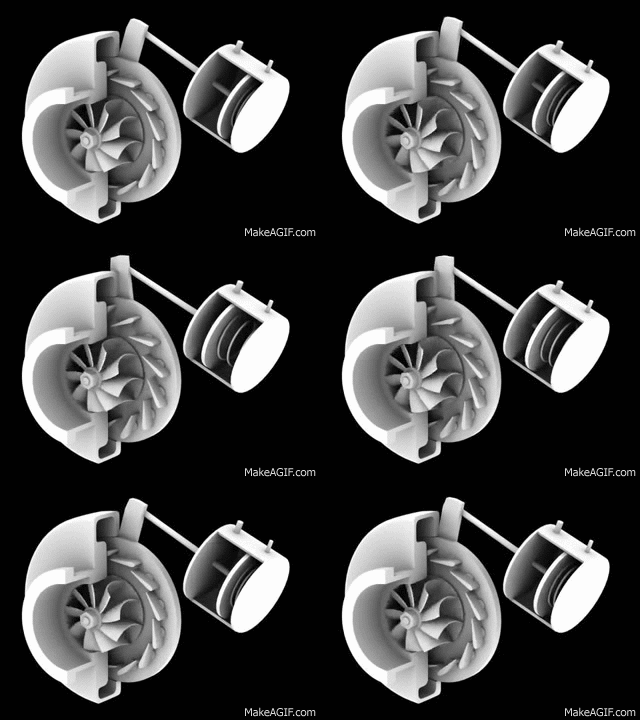
An industry analysis of where the efficiency actually comes from in a modern diesel engine. It starts from the four-stroke cycle and the parts that make it work, then walks through the technologies bolted around it. Downspeeding and dual-clutch transmissions, aerodynamic drag, regenerative braking on hybrids, variable geometry and electric turbochargers, piezoelectric injectors and high-pressure common rails, and hydrogen and water vapor injection.
The comparison at the end is the point. Turbocharging returns the most for the money, with variable geometry setups reported around 15% and two-stage setups around 17%, while high-pressure common rails buy up to 25% more power and torque and aftertreatment carries the emissions side. It is a survey of an old machine that keeps finding room to improve.
Two of the figures in the paper are animations, which a PDF cannot show. They are here instead.

Blurring the Line Between Real and Fake
A critical analysis asking whether people can actually tell AI-generated audio and video from real footage, and what it means for privacy if they cannot. I built a Qualtrics survey around the question and ran it past more than 150 participants, mixing questions about their confidence and concerns with three short clips they had to call real or fake.
The interesting result was not the opinions but the gap underneath them. Over three quarters of participants were confident they could spot generated media, and over 90% wanted AI content labeled by law, yet two of the clips were generated at different quality levels and the better one was confidently read as real by most of the room. Confidence and accuracy came apart, which is the part that makes deepfakes a privacy problem rather than a novelty.