MS-006 · Thermal & Fluids
Thermal & Fluids Laboratory
Overview
Thermal and Fluid Design and Lab (EML4147C) is the University of Florida course where fluids and heat transfer stop being homework and turn into hardware. Each lab is a real apparatus, a data acquisition run, and a formal report with a full uncertainty analysis. I am in a group of four with Erek Dibbern, Gerardo Duran and Yaroslava Izotova.
Diesel engine teardown
The most hands-on thing I have done in a lab so far. We took a Cummins QSF 3.8, a four-cylinder turbodiesel, from a complete engine on the stand down to the bare short block, then looked at how every system we removed fits into the cycle.
The nameplate rates it at 97 kW (130 hp) at 2,500 RPM with a 950 RPM idle and a 1-3-4-2 firing order, built in December 2014. With the head off, the four bores and the piston crowns are right there, which makes the compression ignition cycle from the lectures very concrete. It also connects to a paper I wrote on where diesel engine efficiency comes from.
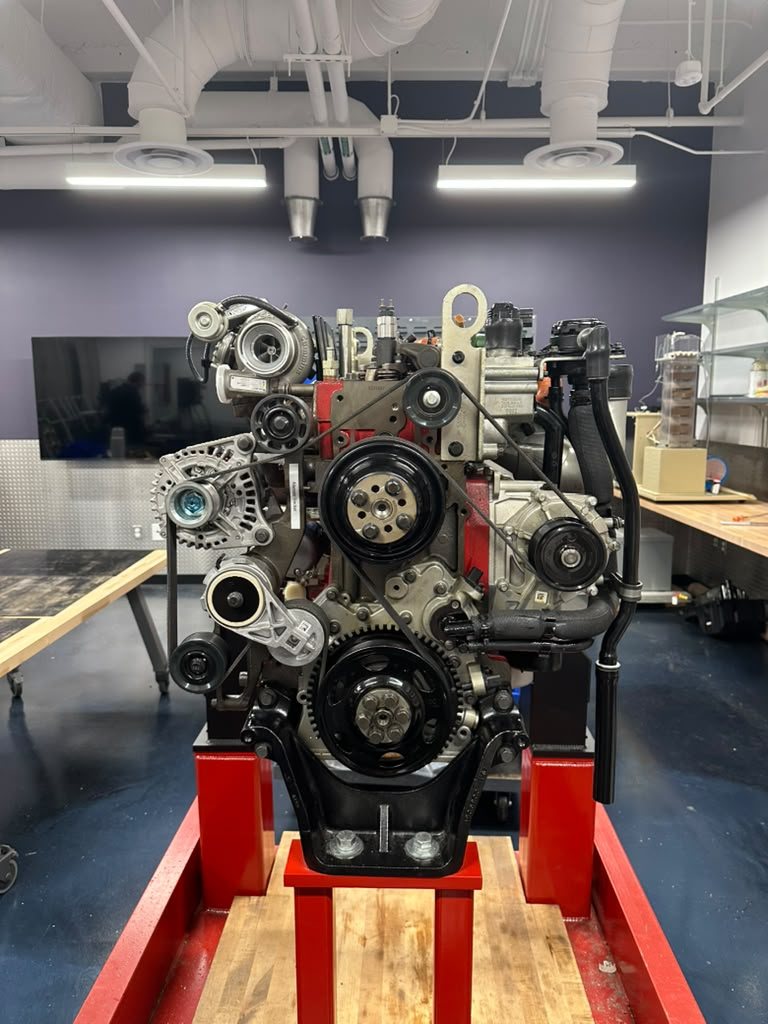
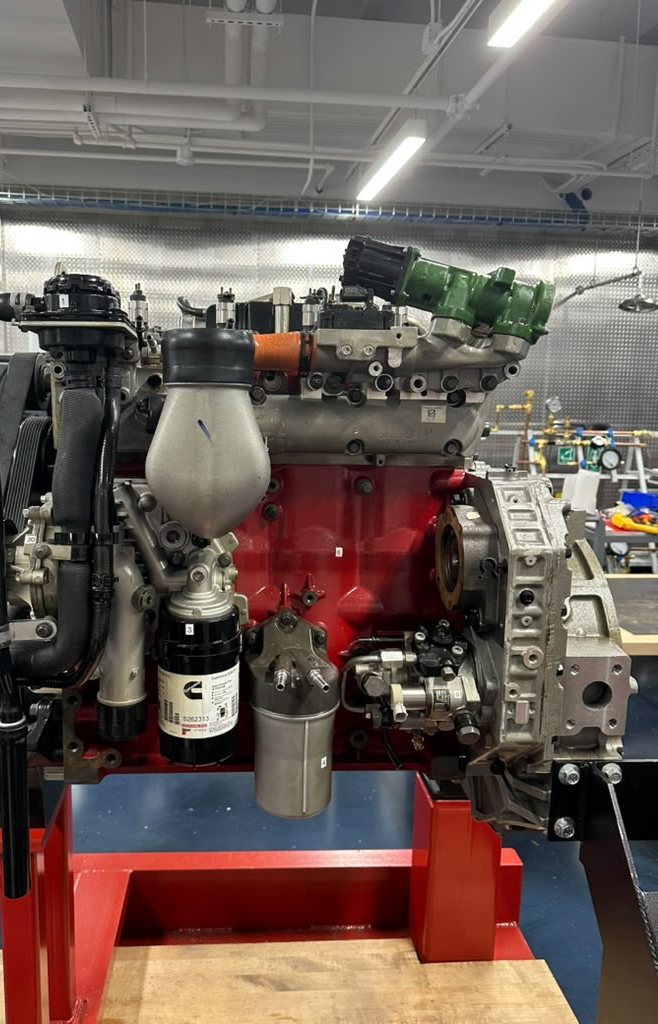
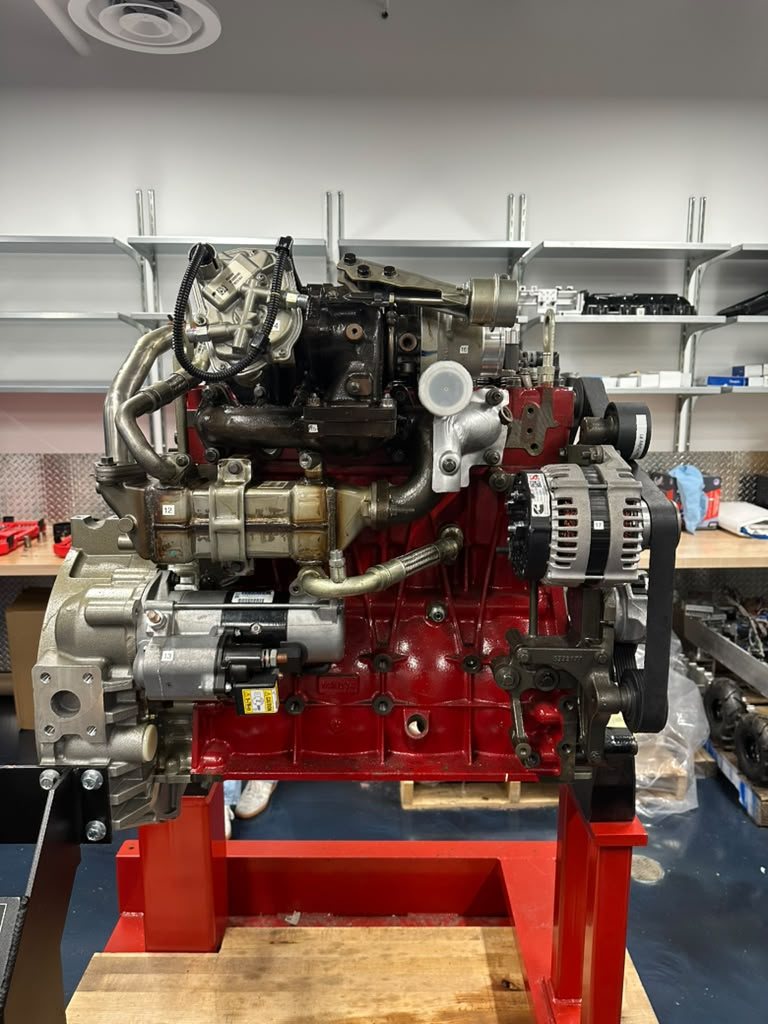
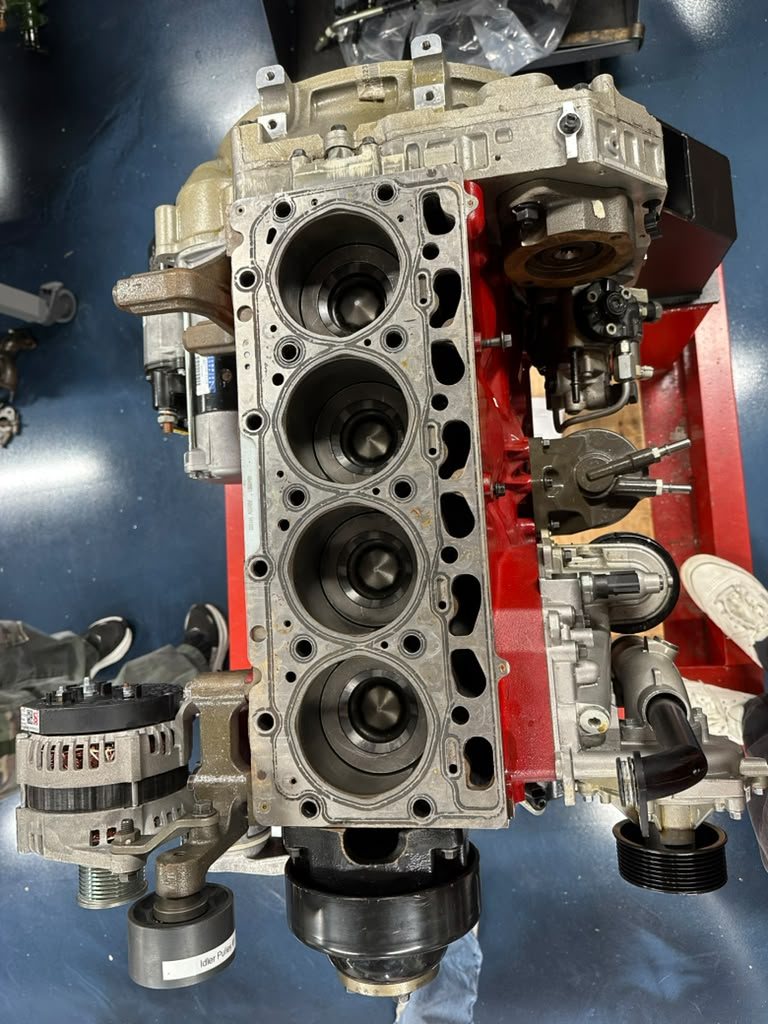
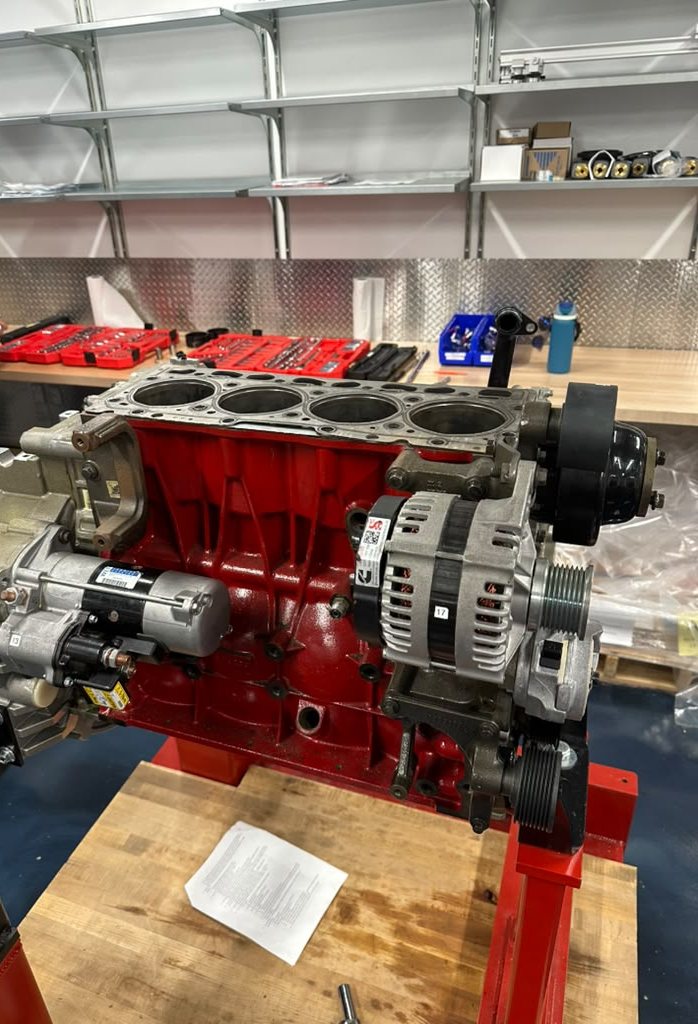
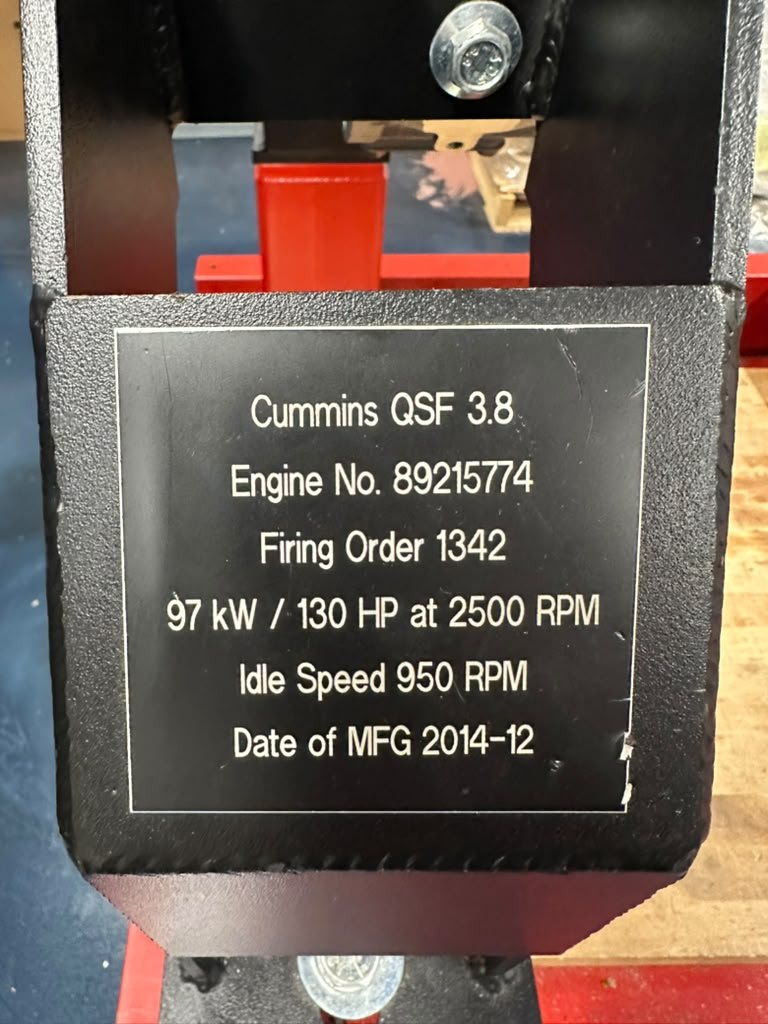
Walkaround with the valve cover off
Fan Performance
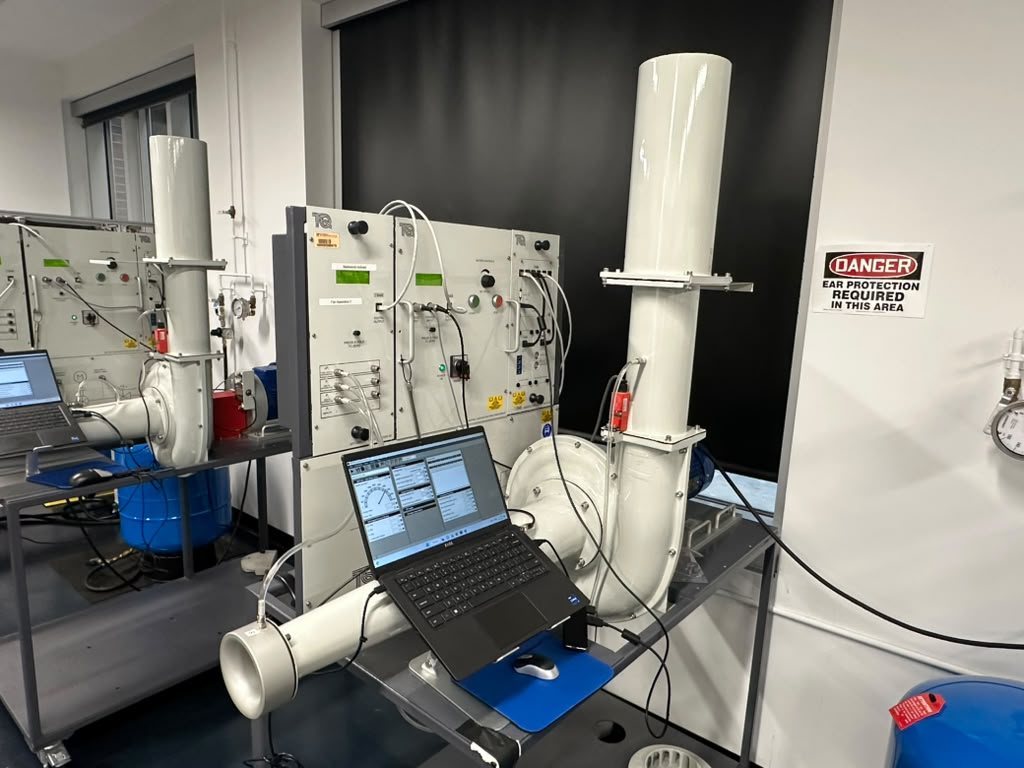 The centrifugal fan module
We compared two 252 mm impellers, one with backward inclined blades and one with radial blades. Each fan ran at five speeds from 1,000 to 3,000 RPM, and at every speed the slide valve stepped the flow from fully open to fully closed in 10% steps. Four pressure transducers on a VDAS system logged each point after the speed settled.
From the raw pressures we built head rise, air power and efficiency curves for both fans, then turned efficiency into a yearly running cost at local utility rates. At 3,000 RPM and full flow the backward inclined fan ran at 88.3% efficiency for about $134 a year, against 71.8% and about $205 for the radial fan. The skill I took from it was treating a test matrix of a hundred points as one dataset, with a processing pipeline that stays the same from the first point to the last.
 Private
Fan Performance Report
Heat Exchanger
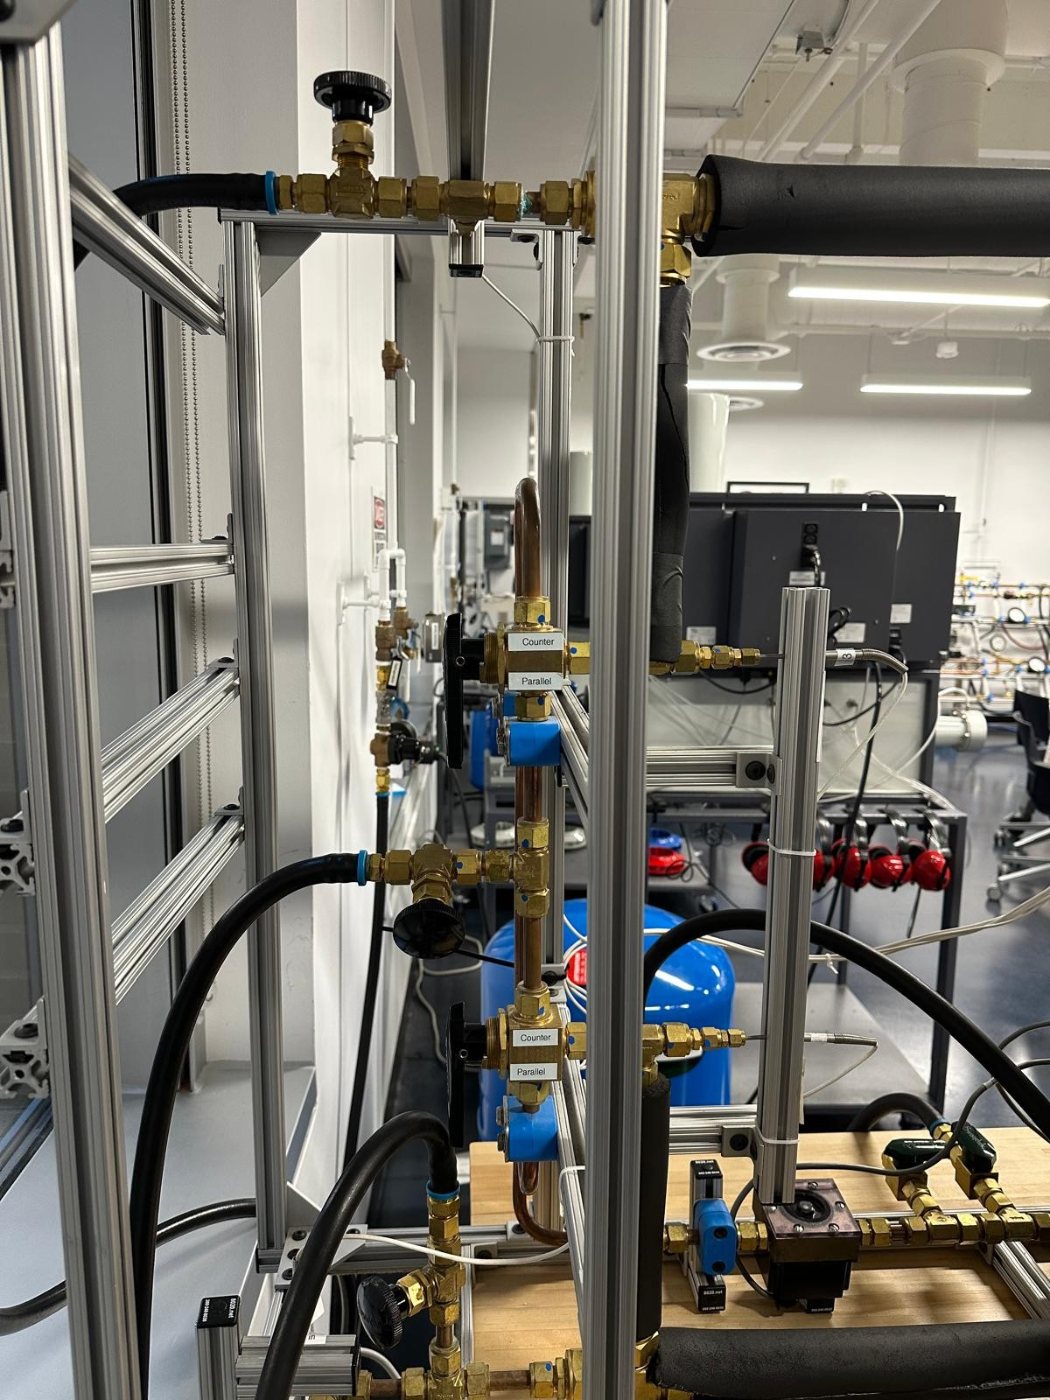 The heat exchanger, with its counter and parallel flow valves
A 3.05 m double pipe heat exchanger, hot water in a copper inner tube and cold water in a brass outer shell, tested in both parallel flow and counter flow. Tubular probes read the temperature at the inlet, midpoint and exit of each stream, and the flowmeters were calibrated first so every voltage could be turned into a flow rate.
We worked the data through log mean temperature difference, effectiveness and NTU, and compared the measured UA against a thermal resistance model built from Reynolds, Prandtl and Nusselt numbers. Measured UA came in at about 94% of theory, and the gap gave the fouling factor. Counter flow beat parallel flow on both LMTD and effectiveness (0.41 against 0.38), which is the result the theory predicts. This lab is where carrying uncertainty through a long chain of derived quantities really started to make sense to me.
 Private
Heat Exchanger Report
Pipe Loss
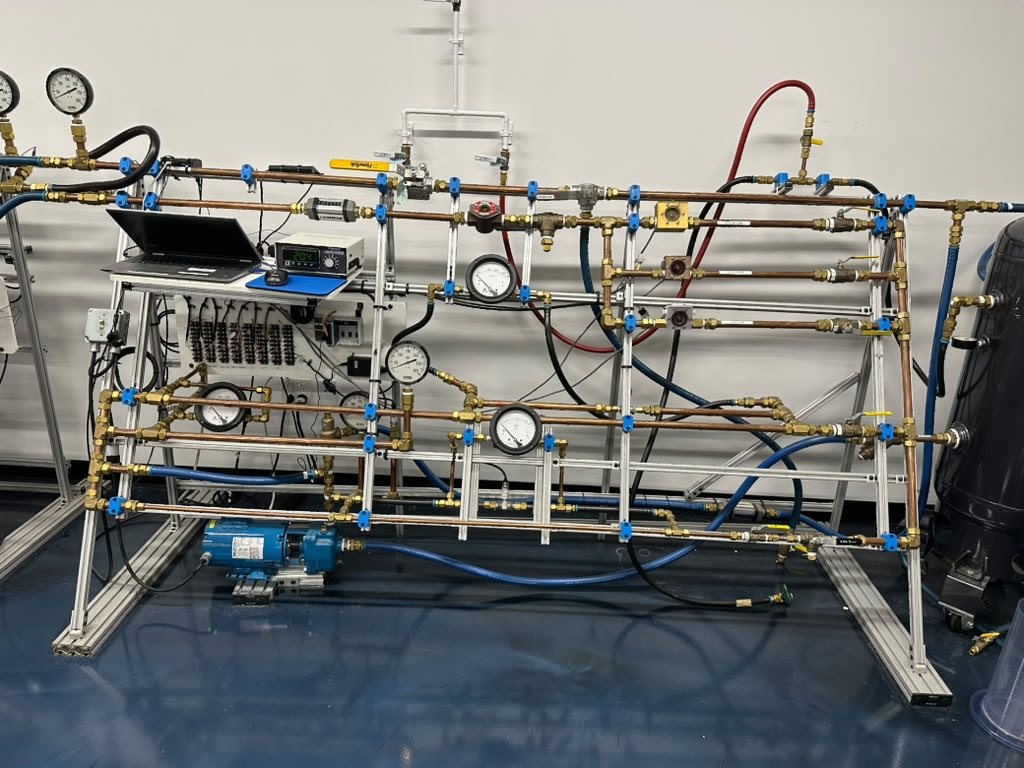 The pipe loss rig, set up for a run
Two one meter pipe sections and the elbow between them, reduced to friction factor, head loss, roughness and a loss coefficient. Nominal bores were not good enough for that, so we measured the pipes with calipers across five cross sections first. A LabVIEW VI logged differential pressure and flow at ten valve settings.
Head losses came out of Darcy-Weisbach and friction factors out of Colebrook, with every uncertainty propagated by root sum of squares. A tenfold increase in flow produced only a 24 times rise in head loss, because the friction factor falls as the Reynolds number climbs. A sampling study at a fixed 400 Hz showed that in the shortest run window the scatter at low flow was bigger than the head loss itself, which is why the analysis trusts the ten second runs.
 Private
Pipe Loss Report
Cooling Tower
A bench cooling tower, with warm water falling through packing while a fan pushes air up against it, judged by how much heat it could reject. Wet and dry bulb temperatures at the air inlet and outlet gave the humidity ratio and relative humidity off a psychrometric chart, and the pressure drop across the column gave the dry air flow. We ran six conditions, water at 20, 30 and 40 g/s under 0.5 kW and 1.5 kW of heating.
A first law energy balance predicted the outlet water temperature and the heat rejected for each run. The air picked up moisture every time, and in two of the 1.5 kW runs it left fully saturated at 100% relative humidity. The water came out 0.7 to 4.1 degrees cooler than predicted, and the tower rejected more heat than the model expected, by as little as 1.1 W at 40 g/s and 0.5 kW and as much as 582 W at 20 g/s and 1.5 kW. Within each heater setting, the higher the water flow the closer the tower tracked the prediction.
 Private
Cooling Tower Report
These reports are kept private. If you have a question about the work, message me.