MS-003 · Mechanics & Materials
Mechanics of Materials Laboratory
Overview
EML3301C is the hands-on instrumentation course in UF's mechanical engineering curriculum. Over three lab reports and a team final project, I built and calibrated strain-gauge measurement systems, pulled materials apart on a universal testing machine, and learned how much of an experimental result depends on the measurement chain rather than the specimen. Every report was written to IEEE format with a full uncertainty analysis.
Labs 1 to 3
Three individual labs, each one building a measurement system and then testing how far it can be trusted. A strain gauge on a feeler gauge, a cantilever beam turned into a scale, and four materials pulled to failure.
Lab 1, Radius Estimation by Dynamic Data Acquisition
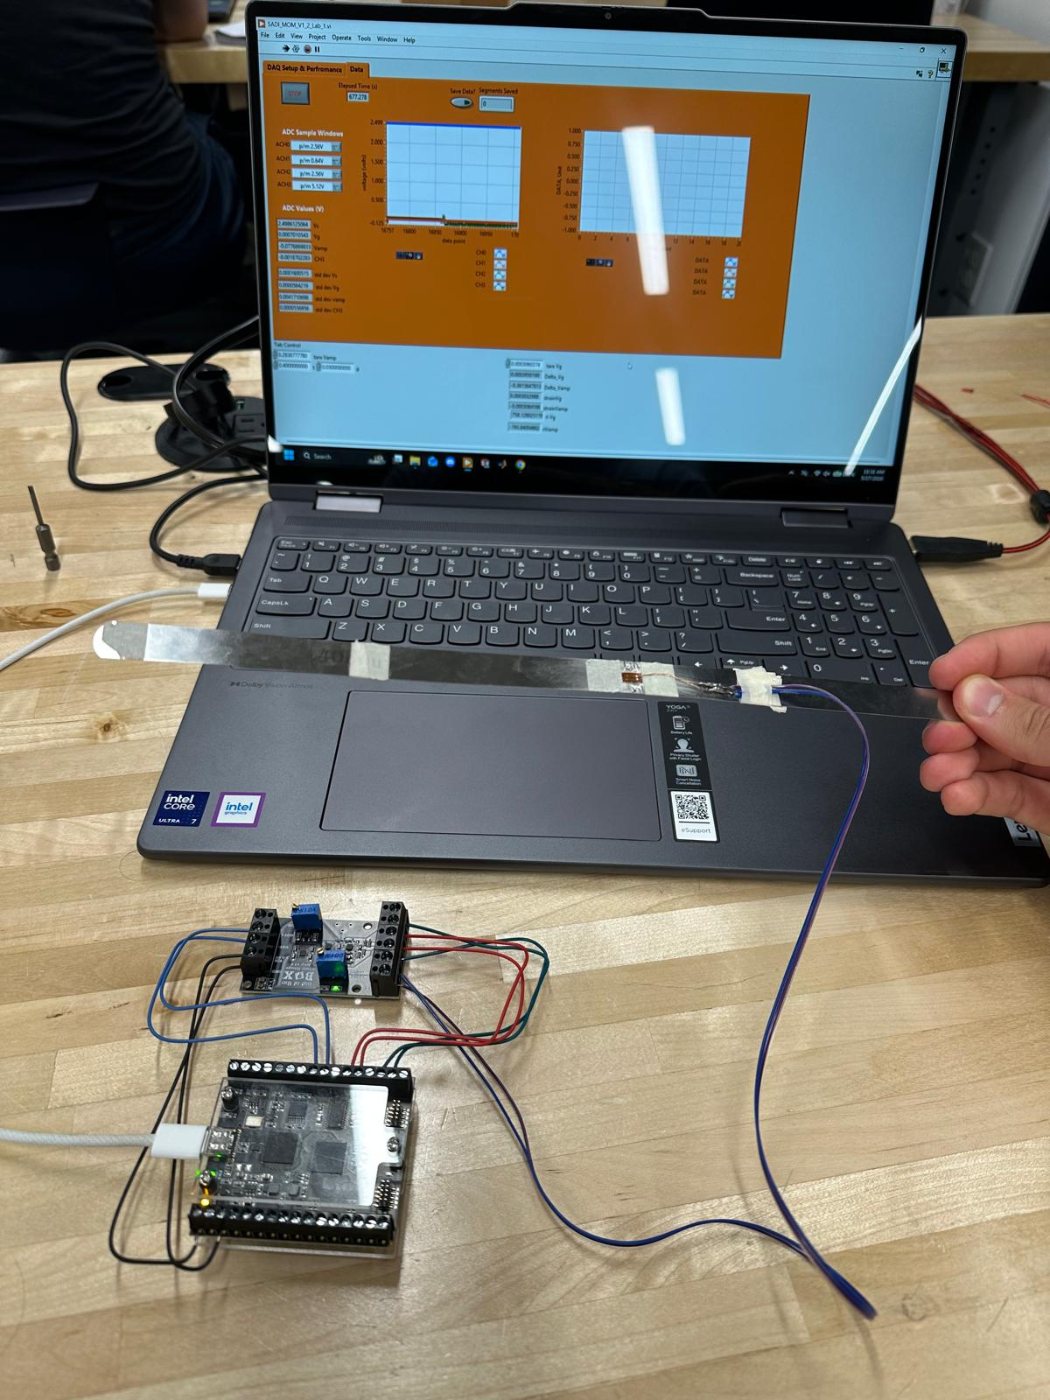
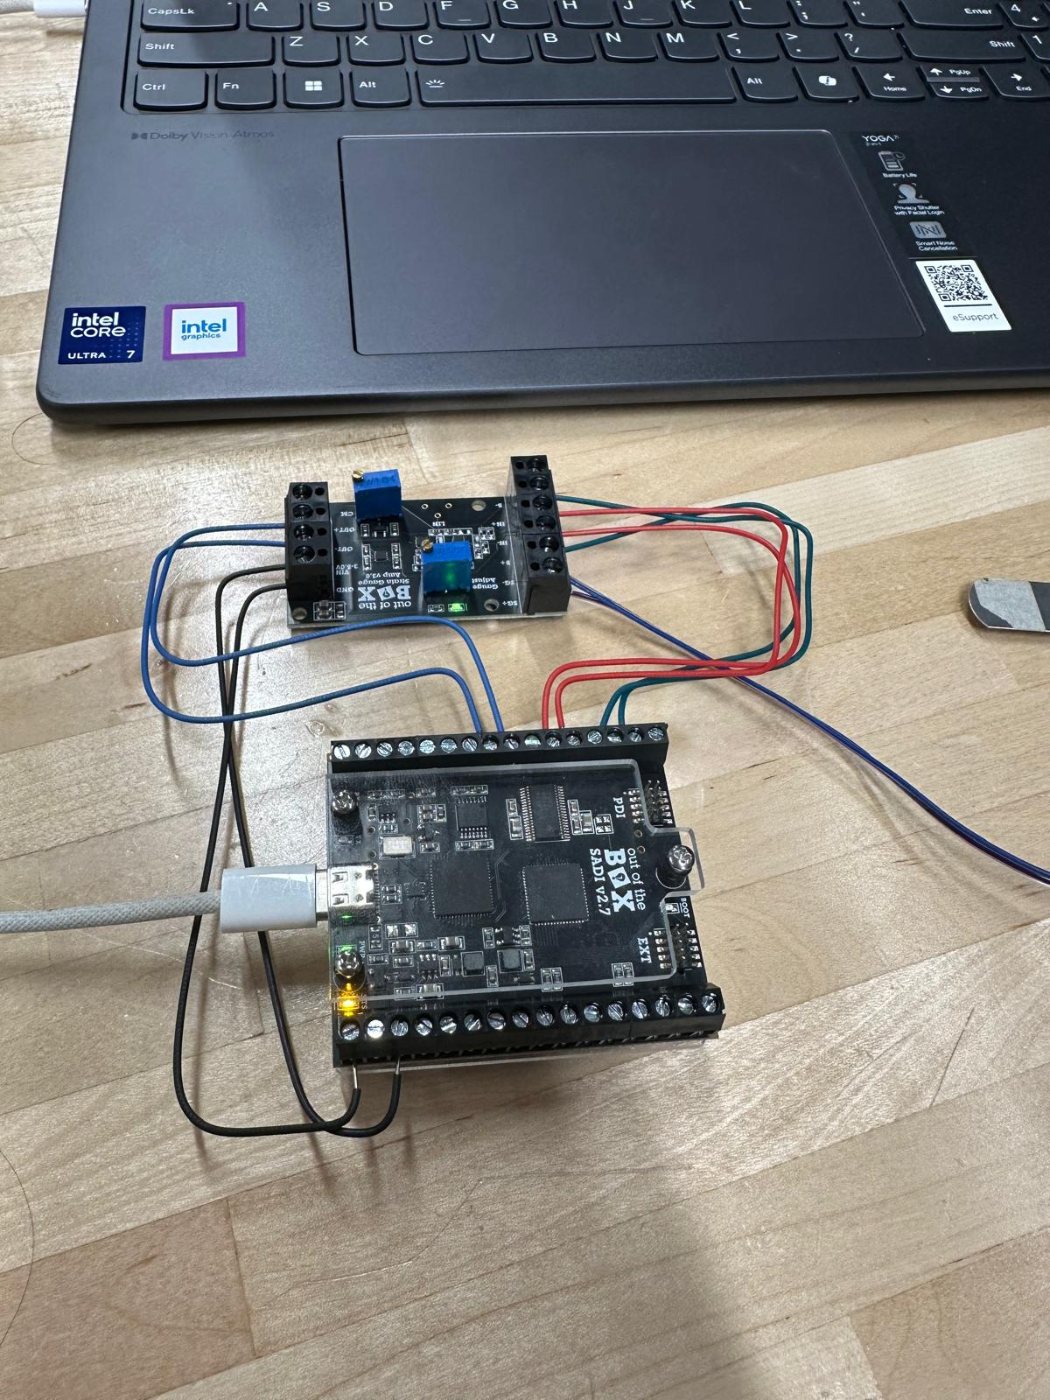
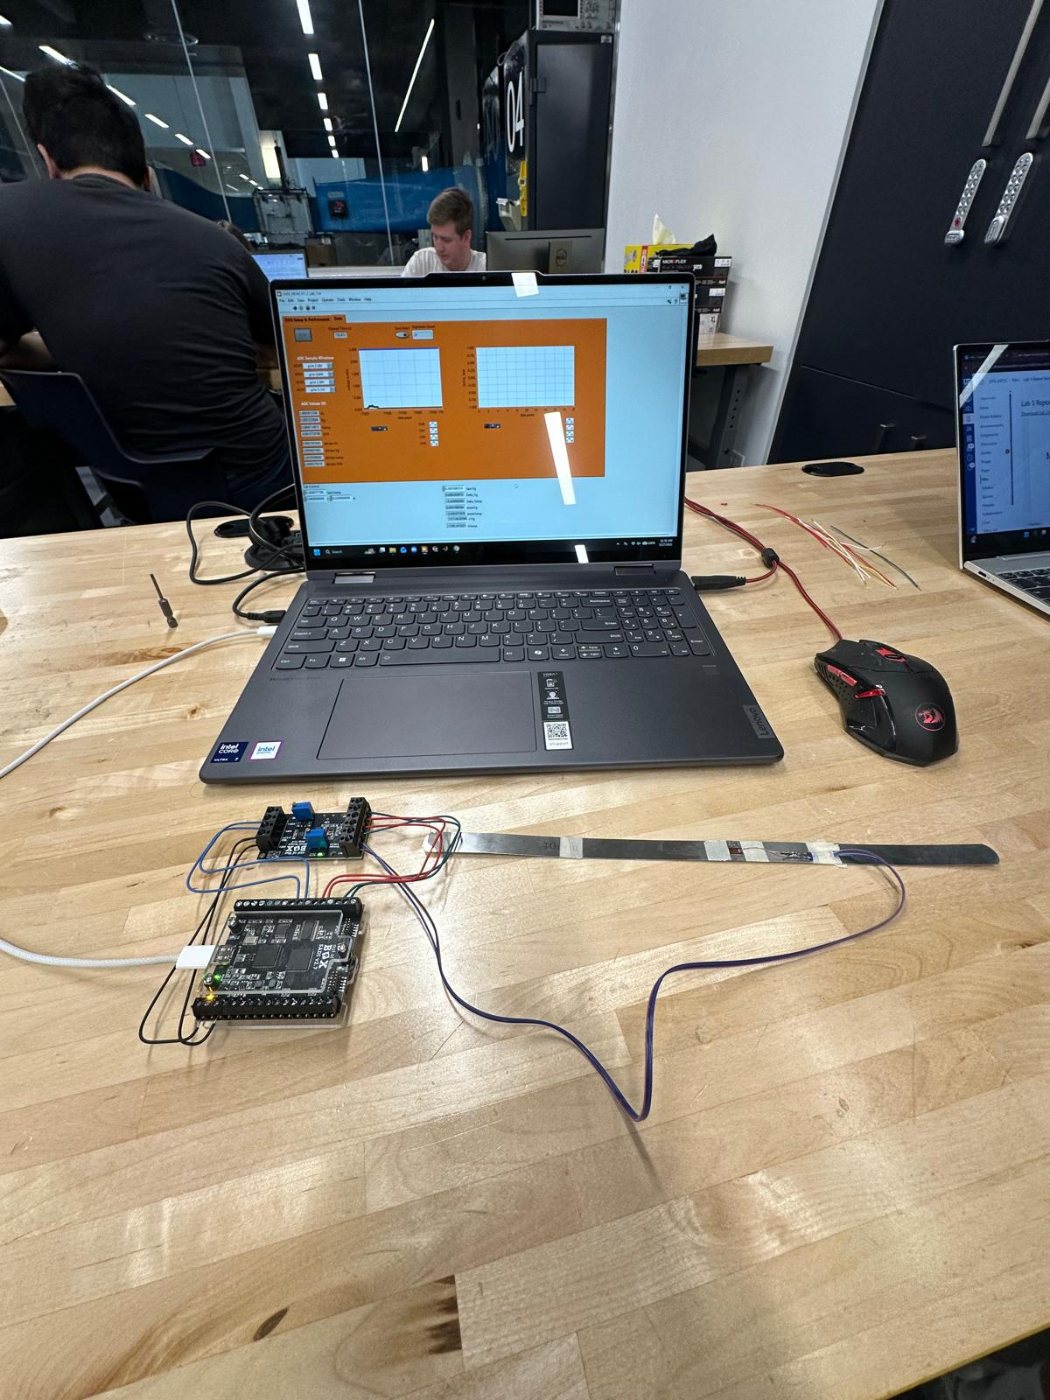
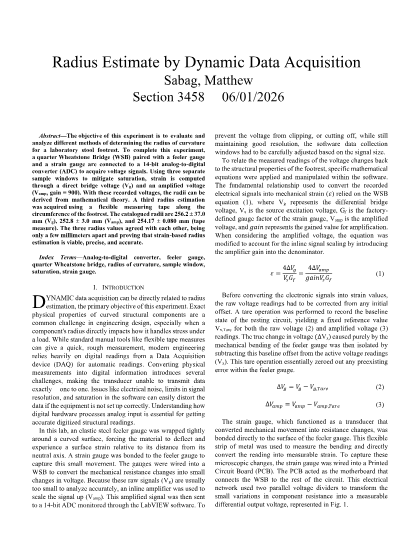
Bonded a strain gauge to a steel feeler gauge, wrapped it around the footrest of a lab stool, and wired it into a quarter Wheatstone bridge feeding a 14-bit ADC through LabVIEW. Because the raw bridge signal is tiny, an inline amplifier scaled it by a gain of 900, and three separate sample windows were used to keep the reading off the rails without giving up resolution.
The radius came out to 256.2 ± 37.0 mm from the raw bridge voltage, 252.8 ± 3.0 mm from the amplified signal, and 254.17 ± 0.080 mm from a tape measure. Three independent methods agreeing within a few millimeters. The tighter uncertainty on the amplified channel is the whole lesson. The same physical measurement gets an order of magnitude more precise once the signal is scaled to use the converter's full range.
Lab 2, Weight Estimation by Dynamic Data Acquisition
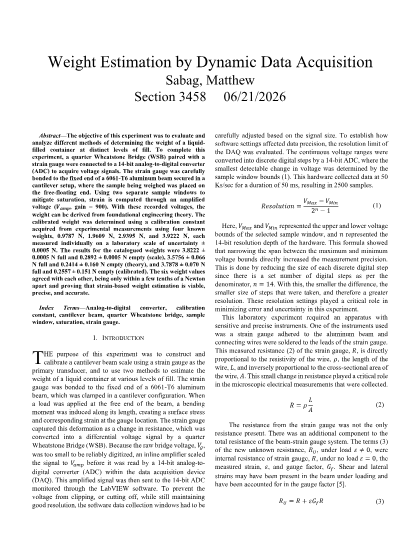
Turned a 6061-T6 aluminum cantilever beam into a scale. A strain gauge at the fixed end measured the bending strain induced by a load hung off the free end, and the system was calibrated against four known weights between 0.9787 N and 3.9222 N to extract a calibration constant.
Measuring a liquid-filled container full and empty gave 3.8222 N / 0.2892 N on a laboratory scale, 3.5756 N / 0.2414 N from theory alone, and 3.7878 N / 0.2557 N from the calibrated beam. The calibrated result beat the purely theoretical one, which is the point. A real beam has geometry and material tolerances that first-principles equations don't capture, and calibration absorbs them.
Lab 3, Displacement-Controlled Uniaxial Testing
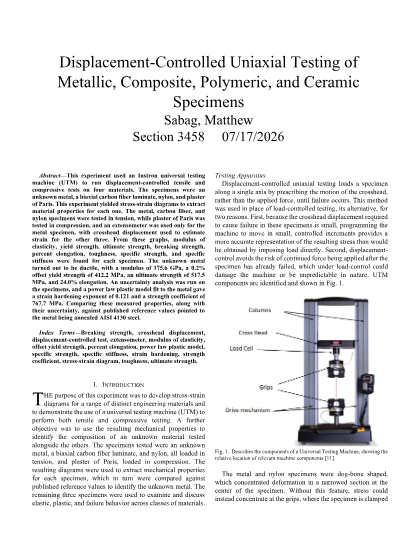
Ran four materials to failure on an Instron universal testing machine. An unknown metal, a biaxial carbon fiber laminate, and nylon in tension, and plaster of Paris in compression. An extensometer measured strain directly on the metal, and the other three had to use crosshead displacement, since the extensometer only works in tension, only up to about 40% elongation, and not on materials that fracture without extending.
The resulting stress-strain diagrams gave a modulus of elasticity of 175.6 GPa, a 0.2% offset yield strength of 412.2 MPa, an ultimate strength of 517.5 MPa, and 24.0% elongation for the unknown metal. Fitting a power-law plastic model returned a strain hardening exponent of 0.121 and a strength coefficient of 767.7 MPa. Comparing all of those against published values, with uncertainty carried through, identified the specimen as annealed AISI 4130 steel.
Final Project, Missing the Warning Signs
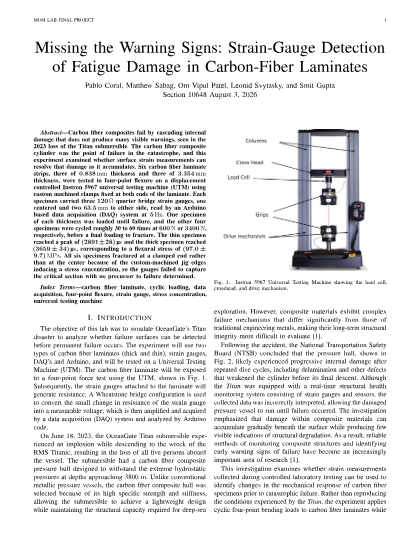
A five-person team project asking whether surface strain measurements can catch damage accumulating inside a carbon fiber composite before it fails catastrophically. That is the question raised by the 2023 loss of the OceanGate Titan, whose carbon fiber pressure hull was instrumented but whose data was read wrong.
We tested six carbon fiber laminate strips, three at 0.838 mm and three at 3.354 mm, in four-point flexure on an Instron 5967 using custom machined clamps. Each specimen carried three 120 Ω quarter-bridge strain gauges, one centered and two at ±63.5 mm, read by an Arduino-based DAQ at 5 Hz. Four specimens were cycled 30 to 60 times at 600 N or 3400 N before being loaded to fracture. Peak strain reached 2891 ± 28 µε on the thin specimens and 3659 ± 34 µε on the thick ones, giving a flexural stress of 97.0 ± 9.7 MPa.
We didn't find the precursor we were looking for, and the report says so. Peak strain per cycle held within 1.9% of its mean through 60.5 cycles, comparable to the resolution of the acquisition chain itself, so no gradual stiffness loss could be resolved at that cycle count. More importantly, every specimen fractured next to a clamped end rather than at the center. The edges of our own machined jig introduced a stress concentration that pulled the peak bending moment away from where the gauges were. The instrumentation was measuring a section that was never going to fail. Working out why the experiment missed, and being able to point at the fixture as the cause, ended up being the most useful thing the project produced.
I wrote the abstract, the conclusion, the uncertainty analysis appendix, and the references.
Photos & videos from testing Google Drive
What I took away
Strain gauges, Wheatstone bridges, and signal amplification. ADC resolution, saturation, and why sample windows matter. LabVIEW and Arduino-based data acquisition. Tensile, compressive, and four-point flexural testing on a universal testing machine. Reading stress-strain diagrams for modulus, yield, ultimate strength, and toughness. Propagating uncertainty and building Student-t confidence intervals, then writing all of it up in IEEE format.